Utilizing your Meeting Metrics
You just wrapped up a three-day sales kickoff. The energy in the room felt high, the coffee breaks were buzzing, and the closing keynote received a standing ovation. When your VP asks, “How did the event go?”, your instinct is to say, “It was a huge success.”
But instinct isn’t enough anymore.
In the past, gut feelings were often the primary measure of an event’s success. Today, leadership teams demand more. They want to know the return on investment (ROI), engagement levels, and where every dollar of the budget went. For modern planners, the difference between a “good feeling” and a strategic win lies in the numbers.
Moving from reactive planning to data-driven decision-making doesn’t have to be overwhelming. In fact, when you have the right numbers in front of you, it actually reduces stress. It removes the guesswork and gives you the confidence to lead your stakeholders through the planning process with authority.
Let’s look at how you can move away from static spreadsheets and start using data to tell a compelling story about your events.
Moving Beyond Basic Headcounts
Most planners track the basics: total registrations and total spend. While these are necessary, they are lagging indicators—they tell you what happened after it’s too late to change the outcome. To truly drive strategy, you need to look at leading indicators and deeper engagement data.
A meaningful meeting metric should answer a specific question about your goals. Instead of just counting heads, consider tracking data points that reveal behavior and value:
- Registration Velocity: How fast are people signing up compared to previous years? A sudden drop in velocity might signal that a marketing email missed the mark or that the registration page is too complicated.
- Cost Per Attendee (CPA): Beyond the total budget, how does the CPA fluctuate as attendance numbers shift? This helps you negotiate F&B minimums more effectively.
- Session Attendance vs. Capacity: Which breakouts are overflowing? Which are empty? This data helps you adjust room allocations in real-time or refine content for future agendas.
- Vendor Spend by Category: Are AV costs creeping up year over year? Tracking this granularly helps you spot trends and negotiate better multi-year contracts.
By broadening what you track, you stop reacting to problems and start anticipating them.
The Problem with Static Spreadsheets
We have all been there—managing a multimillion-dollar budget across twelve different Excel versions named “Final_v3_UPDATED.”
The problem with spreadsheets is that they are static. The moment you export a report or save a file, that data is old. If a vendor updates a quote or a department head adds ten attendees, your spreadsheet is instantly inaccurate. This fragmentation leads to errors, version control nightmares, and the constant anxiety that you might be looking at the wrong numbers.
Effective decision-making requires a centralized view. You need a dynamic environment where budget updates, registration numbers, and vendor contracts live in the same ecosystem. When your data lives in one place, you gain a “command center” perspective of your event, allowing you to spot red flags before they become emergencies.
Visualizing Your Vital Signs: Budget and Attendance
If your event has a heartbeat, it’s found in the relationship between your budget and your audience. Visualizing these two areas is critical for maintaining control.
Real-Time Budget Tracking
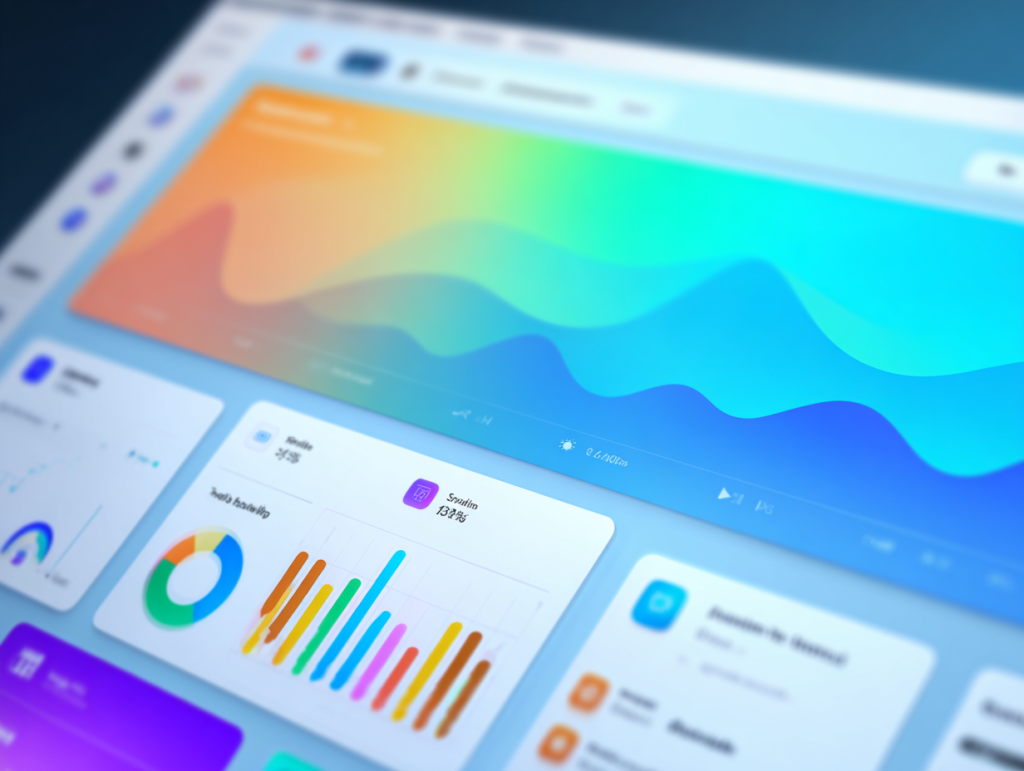
It is easy to lose track of “budget creep”—those small, incremental costs that add up to a massive overage. Visual dashboards allow you to see your committed spend versus your actual spend in real-time.
Imagine seeing a bar chart that instantly shows you have spent 90% of your F&B budget but still have two dinners to plan. That visual cue prompts an immediate strategic decision: do you cut back on the menu, or do you reallocate funds from signage? Seeing the data visually makes the trade-offs clear to both you and your stakeholders.
Attendance and Attrition
Attrition is one of the scariest words in planning. Visualizing attendance data helps you manage this risk. By overlaying your current registration numbers against your hotel block commitments on a timeline, you can see exactly when you are in danger of falling short.
If the data shows you are trending 10% behind your room block pick-up with three weeks to go, you can trigger a focused email campaign to drive bookings. You aren’t hoping for the best; you are using data to intervene.
Using Data to Tell a Story to Leadership
Executives speak the language of business, not logistics. When you present to your leadership team, they don’t necessarily need to know which linen color you chose. They want to know if the event met its business objectives.
This is where event data analytics become your most powerful storytelling tool. Instead of sending a raw spreadsheet to your CFO, use your data to curate a narrative.
- Instead of: “We came in under budget.”
- Say: “By tracking real-time vendor spend, we identified a 15% efficiency in AV costs, which we reallocated to upgrade the attendee welcome experience, directly supporting our goal of higher engagement.”
- Instead of: “People liked the sessions.”
- Say: “Session attendance data shows a 20% increase in participation for the technical workshops compared to last year, indicating a strong demand for hands-on training.”
When you frame data this way, you shift the perception of your role. You aren’t just a logistics manager; you are a strategic partner who understands the organization’s goals and uses resources effectively to achieve them.
Event Alchemē: Your Planning Command Center
At Conference Innovations, we understand that you cannot manage what you cannot measure. That is why we built Event Alchemē.
We saw planners struggling with scattered tools and disjointed email threads, trying to piece together the truth about their events. Event Alchemē is a custom-built portal that replaces that chaos with clarity. It is tailored to your specific workflow, integrating budgets, timelines, vendor tracking, and dashboards into a single, automated workspace.
With Event Alchemē, you don’t have to go hunting for the latest version of the budget or wonder if the hotel contract was signed. It provides a real-time dashboard that gives you immediate visibility into the health of your event. It helps you reduce errors, improve communication with your stakeholders, and operate with the efficiency of a full in-house team.
Clarity Brings Confidence
Data shouldn’t be scary. It should be the tool that helps you sleep better at night. By tracking the right metrics, visualizing your progress, and using systems that centralize your information, you take control of the planning process.
You stop guessing. You stop hoping. And you start leading with confidence, knowing that every decision you make is backed by facts.